Skip to content

Tracing#

Concept#

Tracing is a form of observability that tracks the flow of requests as they move through various services in a distributed system. It provides insights into the interactions between services, highlighting performance bottlenecks and errors. The result of implementing tracing is a detailed map of the service interactions, often visualized as a trace diagram. This helps developers understand the behavior and performance of their applications. For an in-depth explanation, please refer to the OpenTelemetry tracing specification.

HTML-page 
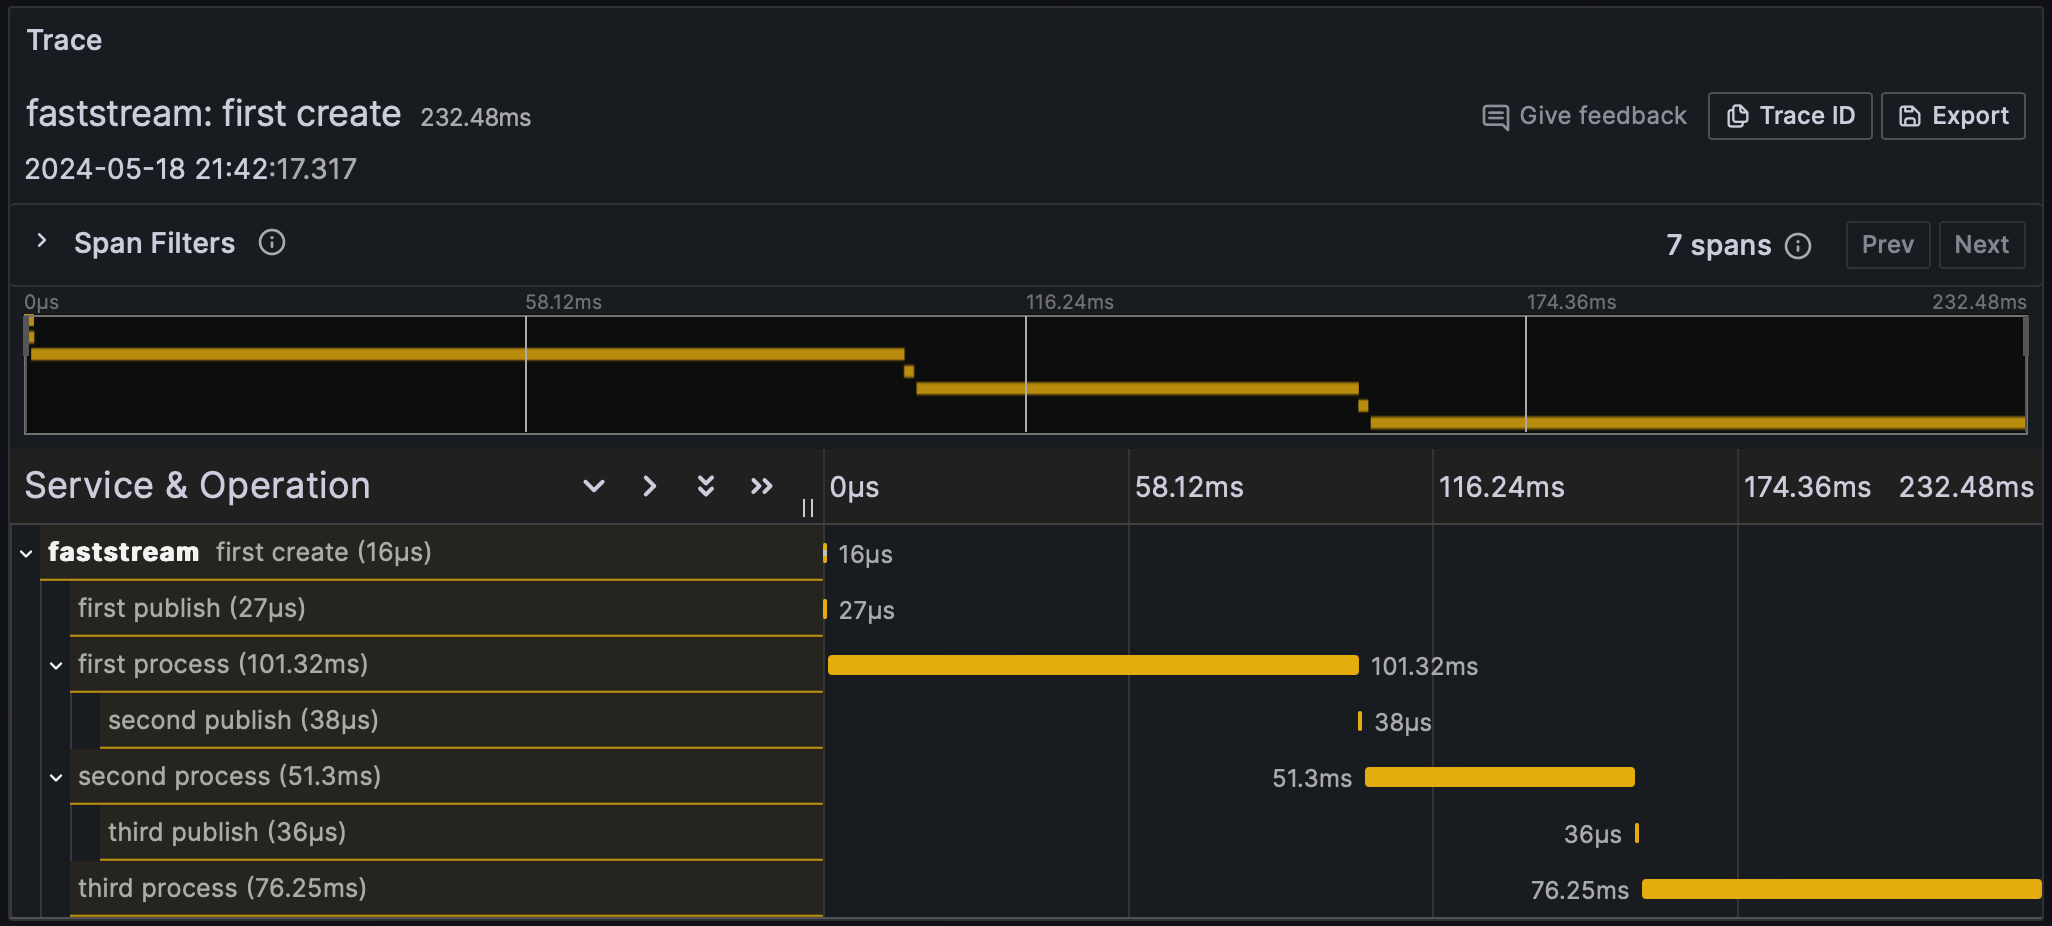
Visualized via Grafana and Tempo

This trace is derived from the relationship between the following handlers:

@broker.subscriber("first")
@broker.publisher("second")
async def first_handler(msg: str):
    await asyncio.sleep(0.1)
    return msg


@broker.subscriber("second")
@broker.publisher("third")
async def second_handler(msg: str):
    await asyncio.sleep(0.05)
    return msg


@broker.subscriber("third")
async def third_handler(msg: str):
    await asyncio.sleep(0.075)

FastStream Tracing#

OpenTelemetry tracing support in FastStream adheres to the semantic conventions for messaging systems.

To enable tracing your broker:

  1. Install FastStream with the opentelemetry-sdk:

    pip install 'faststream[otel]'
    
  2. Configure TracerProvider:

    1
    2
    3
    4
    5
    6
    7
    from opentelemetry import trace
    from opentelemetry.sdk.resources import Resource
    from opentelemetry.sdk.trace import TracerProvider
    
    resource = Resource.create(attributes={"service.name": "faststream"})
    tracer_provider = TracerProvider(resource=resource)
    trace.set_tracer_provider(tracer_provider)
    
  3. Add TelemetryMiddleware to your broker:

from faststream import FastStream
from faststream.kafka import KafkaBroker
from faststream.kafka.opentelemetry import KafkaTelemetryMiddleware

broker = KafkaBroker(
    middlewares=(
        KafkaTelemetryMiddleware(tracer_provider=tracer_provider),
    ),
)
app = FastStream(broker)
from faststream import FastStream
from faststream.confluent import KafkaBroker
from faststream.confluent.opentelemetry import KafkaTelemetryMiddleware

broker = KafkaBroker(
    middlewares=(
        KafkaTelemetryMiddleware(tracer_provider=tracer_provider)
    ),
)
app = FastStream(broker)
from faststream import FastStream
from faststream.rabbit import RabbitBroker
from faststream.rabbit.opentelemetry import RabbitTelemetryMiddleware

broker = RabbitBroker(
    middlewares=(
        RabbitTelemetryMiddleware(tracer_provider=tracer_provider),
    ),
)
app = FastStream(broker)
from faststream import FastStream
from faststream.nats import NatsBroker
from faststream.nats.opentelemetry import NatsTelemetryMiddleware

broker = NatsBroker(
    middlewares=(
        NatsTelemetryMiddleware(tracer_provider=tracer_provider),
    ),
)
app = FastStream(broker)
from faststream import FastStream
from faststream.redis import RedisBroker
from faststream.redis.opentelemetry import RedisTelemetryMiddleware

broker = RedisBroker(
    middlewares=(
        RedisTelemetryMiddleware(tracer_provider=tracer_provider),
    ),
)
app = FastStream(broker)

Warning

OpenTelemetry middleware is supported only for MQTT 5. It is not compatible with MQTT 3.1.1, as that protocol version does not support user properties required for trace context propagation.

from faststream import FastStream
from faststream.mqtt import MQTTBroker
from faststream.mqtt.opentelemetry import MQTTTelemetryMiddleware

broker = MQTTBroker(
    middlewares=(
        MQTTTelemetryMiddleware(tracer_provider=tracer_provider),
    ),
)
app = FastStream(broker)

Exporting#

To export traces, you must configure an exporter. Options include:

There are other exporters also.

To configure the export of traces via opentelemetry-exporter-otlp:

  1. Install the OTLP exporter opentelemetry-exporter-otlp:

    pip install opentelemetry-exporter-otlp
    
  2. Configure the OTLPSpanExporter:

    1
    2
    3
    4
    5
    6
    from opentelemetry.exporter.otlp.proto.grpc.trace_exporter import OTLPSpanExporter
    from opentelemetry.sdk.trace.export import BatchSpanProcessor
    
    exporter = OTLPSpanExporter(endpoint="http://127.0.0.1:4317")
    processor = BatchSpanProcessor(exporter)
    tracer_provider.add_span_processor(processor)
    

Visualization#

To visualize traces, send them to a backend system that supports distributed tracing, such as Jaeger, Zipkin, or Grafana Tempo. These systems provide user interfaces to visualize and analyze traces.

  • Jaeger: Run Jaeger using Docker and configure your OpenTelemetry middleware to send traces to Jaeger. For more details, see the Jaeger documentation.
  • Zipkin: Like Jaeger, Zipkin can be run using Docker and configured with OpenTelemetry middleware. For more details, see the Zipkin documentation.
  • Grafana Tempo: Grafana Tempo is a high-scale, distributed tracing backend. Configure OpenTelemetry to export traces to Tempo, which can then be visualized using Grafana. For more details, see the Grafana Tempo documentation.

Context Propagation#

Quite often it is necessary to communicate with other services by propagating the trace context. To propagate the trace context, use the CurrentSpan object:

from opentelemetry import trace, propagate
from faststream.opentelemetry import CurrentSpan

@broker.subscriber("symbol")
async def handler(
    msg: str,
    span: CurrentSpan,
) -> None:
    headers = {}
    propagate.inject(headers, context=trace.set_span_in_context(span))
    price = await exchange_client.get_symbol_price(
        msg,
        headers=headers,
    )