OpenTelemetry#
OpenTelemetry is an open-source observability framework designed to provide a unified standard for collecting and exporting telemetry data such as traces, metrics, and logs. It aims to make observability a built-in feature of software development, simplifying the integration and standardization of telemetry data across various services. For more details, you can read the official OpenTelemetry documentation.
Quick Start#
To use OpenTelemetry in FastStream, you just need to:
-
Install
FastStreamalong withopentelemetry-sdkandopentelemetry-exporter-otlppip install "faststream[otel]" opentelemetry-exporter-otlp -
Configure
TracerProviderwith the gRPC exporter:1 2 3 4 5 6 7 8 9 10 11 12
from opentelemetry import trace from opentelemetry.sdk.resources import Resource from opentelemetry.sdk.trace import TracerProvider from opentelemetry.exporter.otlp.proto.grpc.trace_exporter import OTLPSpanExporter from opentelemetry.sdk.trace.export import BatchSpanProcessor resource = Resource.create(attributes={"service.name": "faststream"}) tracer_provider = TracerProvider(resource=resource) trace.set_tracer_provider(tracer_provider) exporter = OTLPSpanExporter(endpoint="http://localhost:4317") processor = BatchSpanProcessor(exporter) tracer_provider.add_span_processor(processor) -
Add
TelemetryMiddlewareto your broker:
1 2 3 4 5 6 7 8 9 10 | |
1 2 3 4 5 6 7 8 9 10 | |
1 2 3 4 5 6 7 8 9 10 | |
1 2 3 4 5 6 7 8 9 10 | |
1 2 3 4 5 6 7 8 9 10 | |
Warning
OpenTelemetry middleware is supported only for MQTT 5. It is not compatible with MQTT 3.1.1, as that protocol version does not support user properties required for trace context propagation.
1 2 3 4 5 6 7 8 9 10 | |
In the following documentation sections, you can find detailed information about all OpenTelemetry features available in FastStream.
OpenTelemetry FastStream Example#
You can also take a look at a pre-configured project and use it as a reference for your services and infrastructure.
To see how to set up, visualize, and configure tracing for FastStream services, check out the example project.
The example includes:
- Three
FastStreamservices - Exporting traces to
Grafana TempoviagRPC - Visualization of traces using
Grafana - Collecting metrics and exporting them with
Prometheus - A
Grafana dashboardfor metrics - Examples with custom spans
- A pre-configured
docker-composewith the entire infrastructure
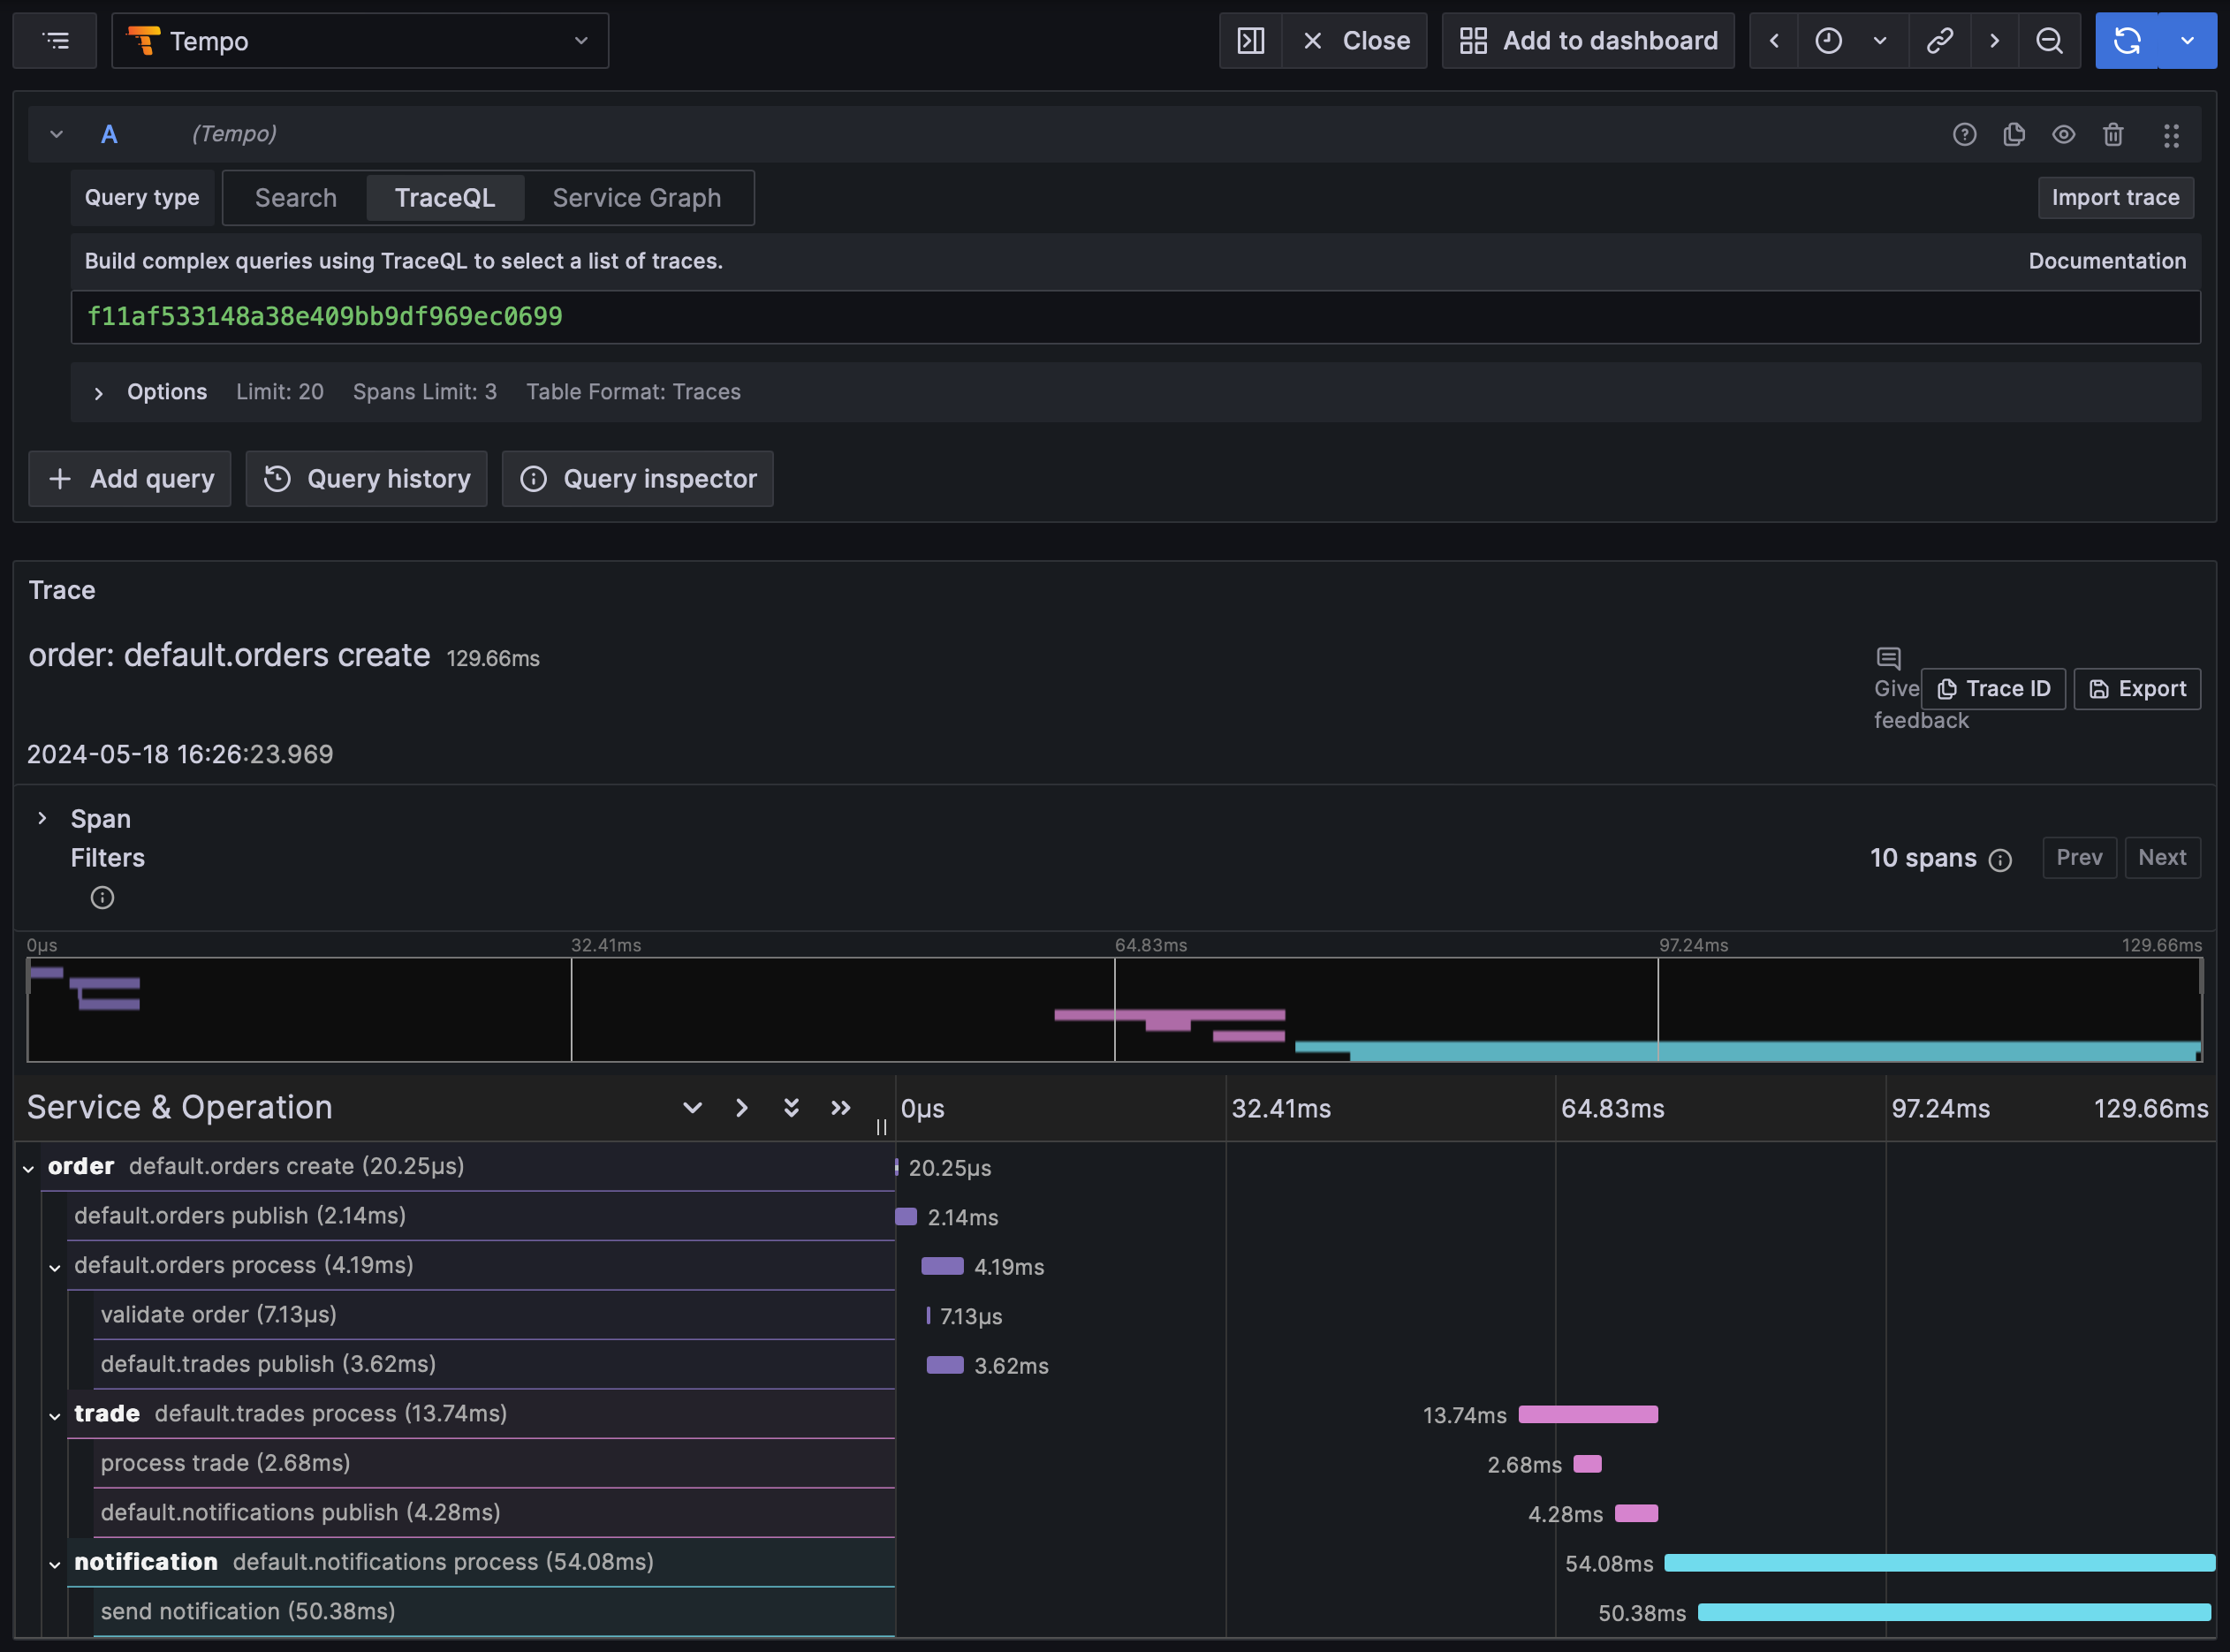
Visualized via Grafana and Tempo