Tracing#
Concept#
Tracing is a form of observability that tracks the flow of requests as they move through various services in a distributed system. It provides insights into the interactions between services, highlighting performance bottlenecks and errors. The result of implementing tracing is a detailed map of the service interactions, often visualized as a trace diagram. This helps developers understand the behavior and performance of their applications. For an in-depth explanation, please refer to the OpenTelemetry tracing specification.
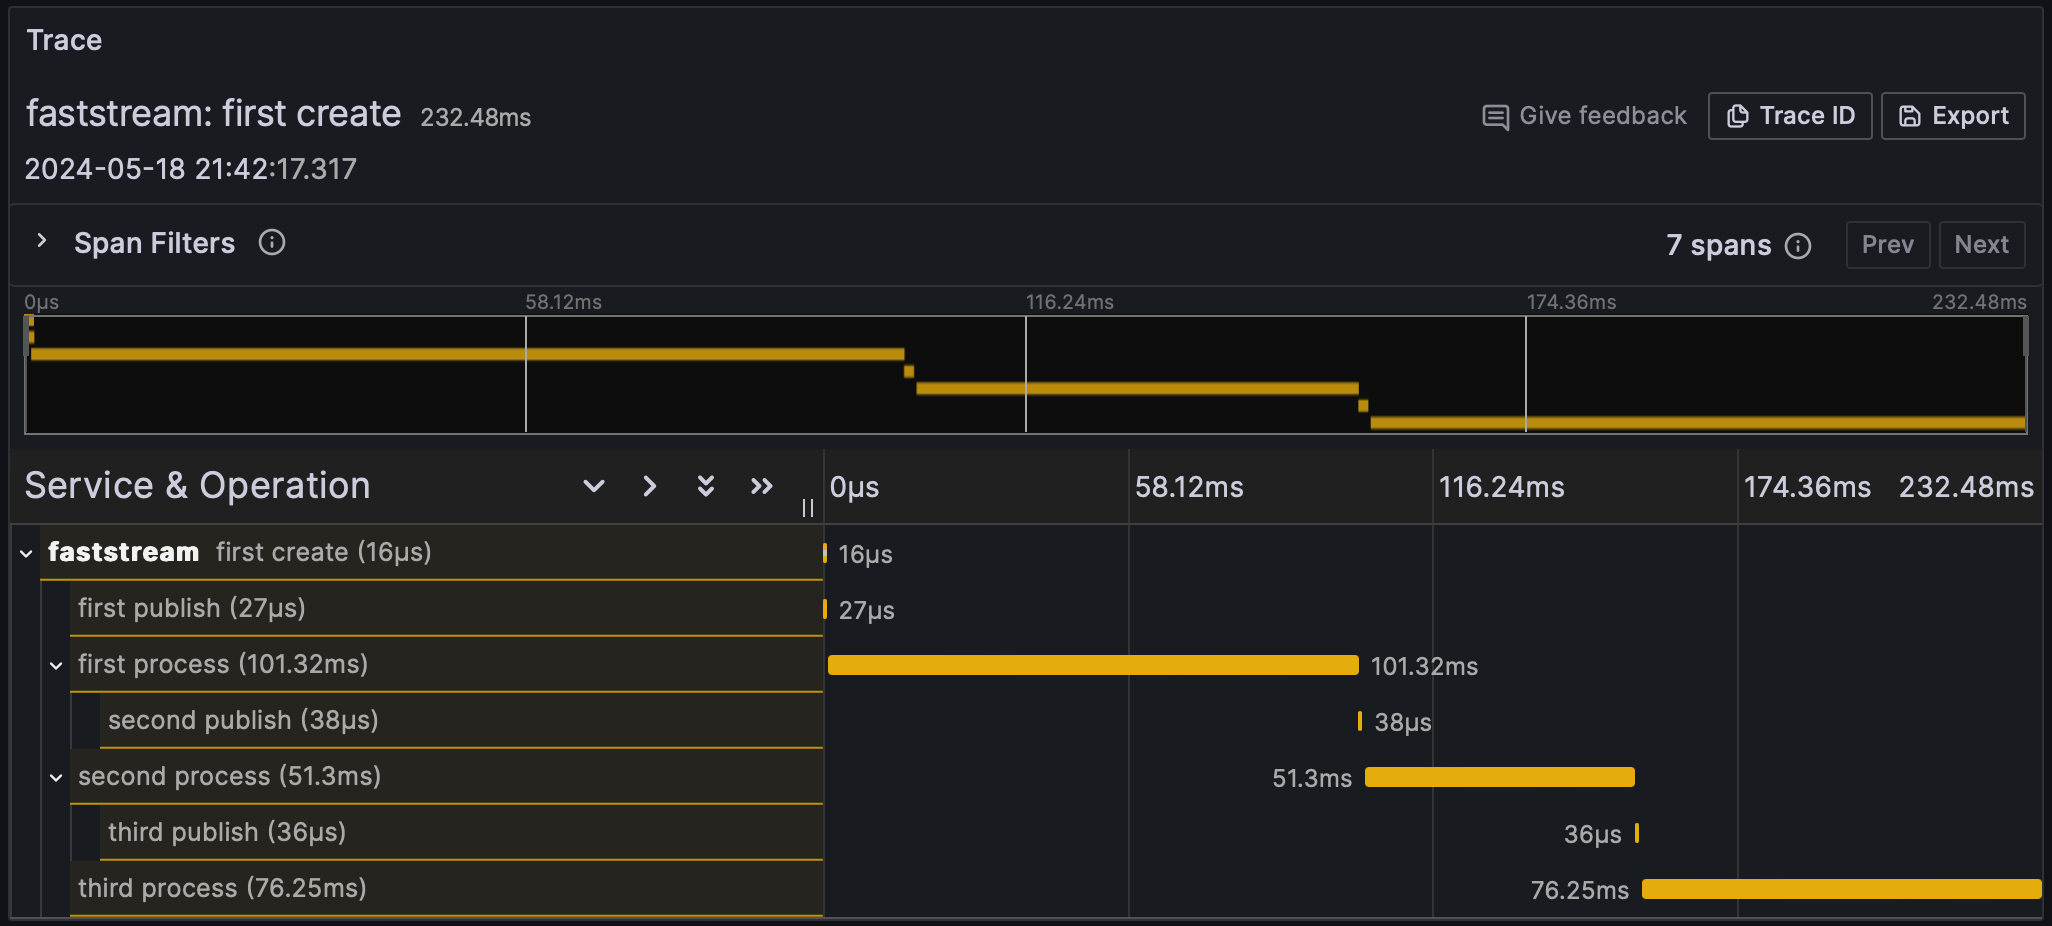
Visualized via Grafana and Tempo
This trace is derived from the relationship between the following handlers:
1 2 3 4 5 6 7 8 9 10 11 12 13 14 15 16 17 | |
FastStream Tracing#
OpenTelemetry tracing support in FastStream adheres to the semantic conventions for messaging systems.
To enable tracing for your broker:
-
Install
FastStreamwith theopentelemetry-sdk:pip install 'faststream[otel]' -
Configure
TracerProvider:1 2 3 4 5 6 7
from opentelemetry import trace from opentelemetry.sdk.resources import Resource from opentelemetry.sdk.trace import TracerProvider resource = Resource.create(attributes={"service.name": "faststream"}) tracer_provider = TracerProvider(resource=resource) trace.set_tracer_provider(tracer_provider) -
Add
TelemetryMiddlewareto your broker:
1 2 3 4 5 6 7 8 9 10 | |
1 2 3 4 5 6 7 8 9 10 | |
1 2 3 4 5 6 7 8 9 10 | |
1 2 3 4 5 6 7 8 9 10 | |
1 2 3 4 5 6 7 8 9 10 | |
Warning
OpenTelemetry middleware is supported only for MQTT 5. It is not compatible with MQTT 3.1.1, as that protocol version does not support user properties required for trace context propagation.
1 2 3 4 5 6 7 8 9 10 | |
Exporting#
To export traces, you must configure an exporter. Options include:
- opentelemetry-exporter-jaeger - for exporting to Jaeger
- opentelemetry-exporter-otlp - for exporting via gRPC or HTTP
InMemorySpanExporterfromopentelemetry.sdk.trace.export.in_memory_span_exporter- for local testing
There are other exporters also.
To configure the export of traces via opentelemetry-exporter-otlp:
-
Install the OTLP exporter
opentelemetry-exporter-otlp:pip install opentelemetry-exporter-otlp -
Configure the
OTLPSpanExporter:1 2 3 4 5 6
from opentelemetry.exporter.otlp.proto.grpc.trace_exporter import OTLPSpanExporter from opentelemetry.sdk.trace.export import BatchSpanProcessor exporter = OTLPSpanExporter(endpoint="http://127.0.0.1:4317") processor = BatchSpanProcessor(exporter) tracer_provider.add_span_processor(processor)
Visualization#
To visualize traces, send them to a backend system that supports distributed tracing, such as Jaeger, Zipkin, or Grafana Tempo. These systems provide user interfaces to visualize and analyze traces.
- Jaeger: Run Jaeger using Docker and configure your OpenTelemetry middleware to send traces to Jaeger. For more details, see the Jaeger documentation.
- Zipkin: Like Jaeger, Zipkin can be run using Docker and configured with OpenTelemetry middleware. For more details, see the Zipkin documentation.
- Grafana Tempo: Grafana Tempo is a high-scale, distributed tracing backend. Configure OpenTelemetry to export traces to Tempo, which can then be visualized using Grafana. For more details, see the Grafana Tempo documentation.
Context Propagation#
Quite often it is necessary to communicate with other services by propagating the trace context. To propagate the trace context, use the CurrentSpan object:
1 2 3 4 5 6 7 8 9 10 11 12 13 14 | |